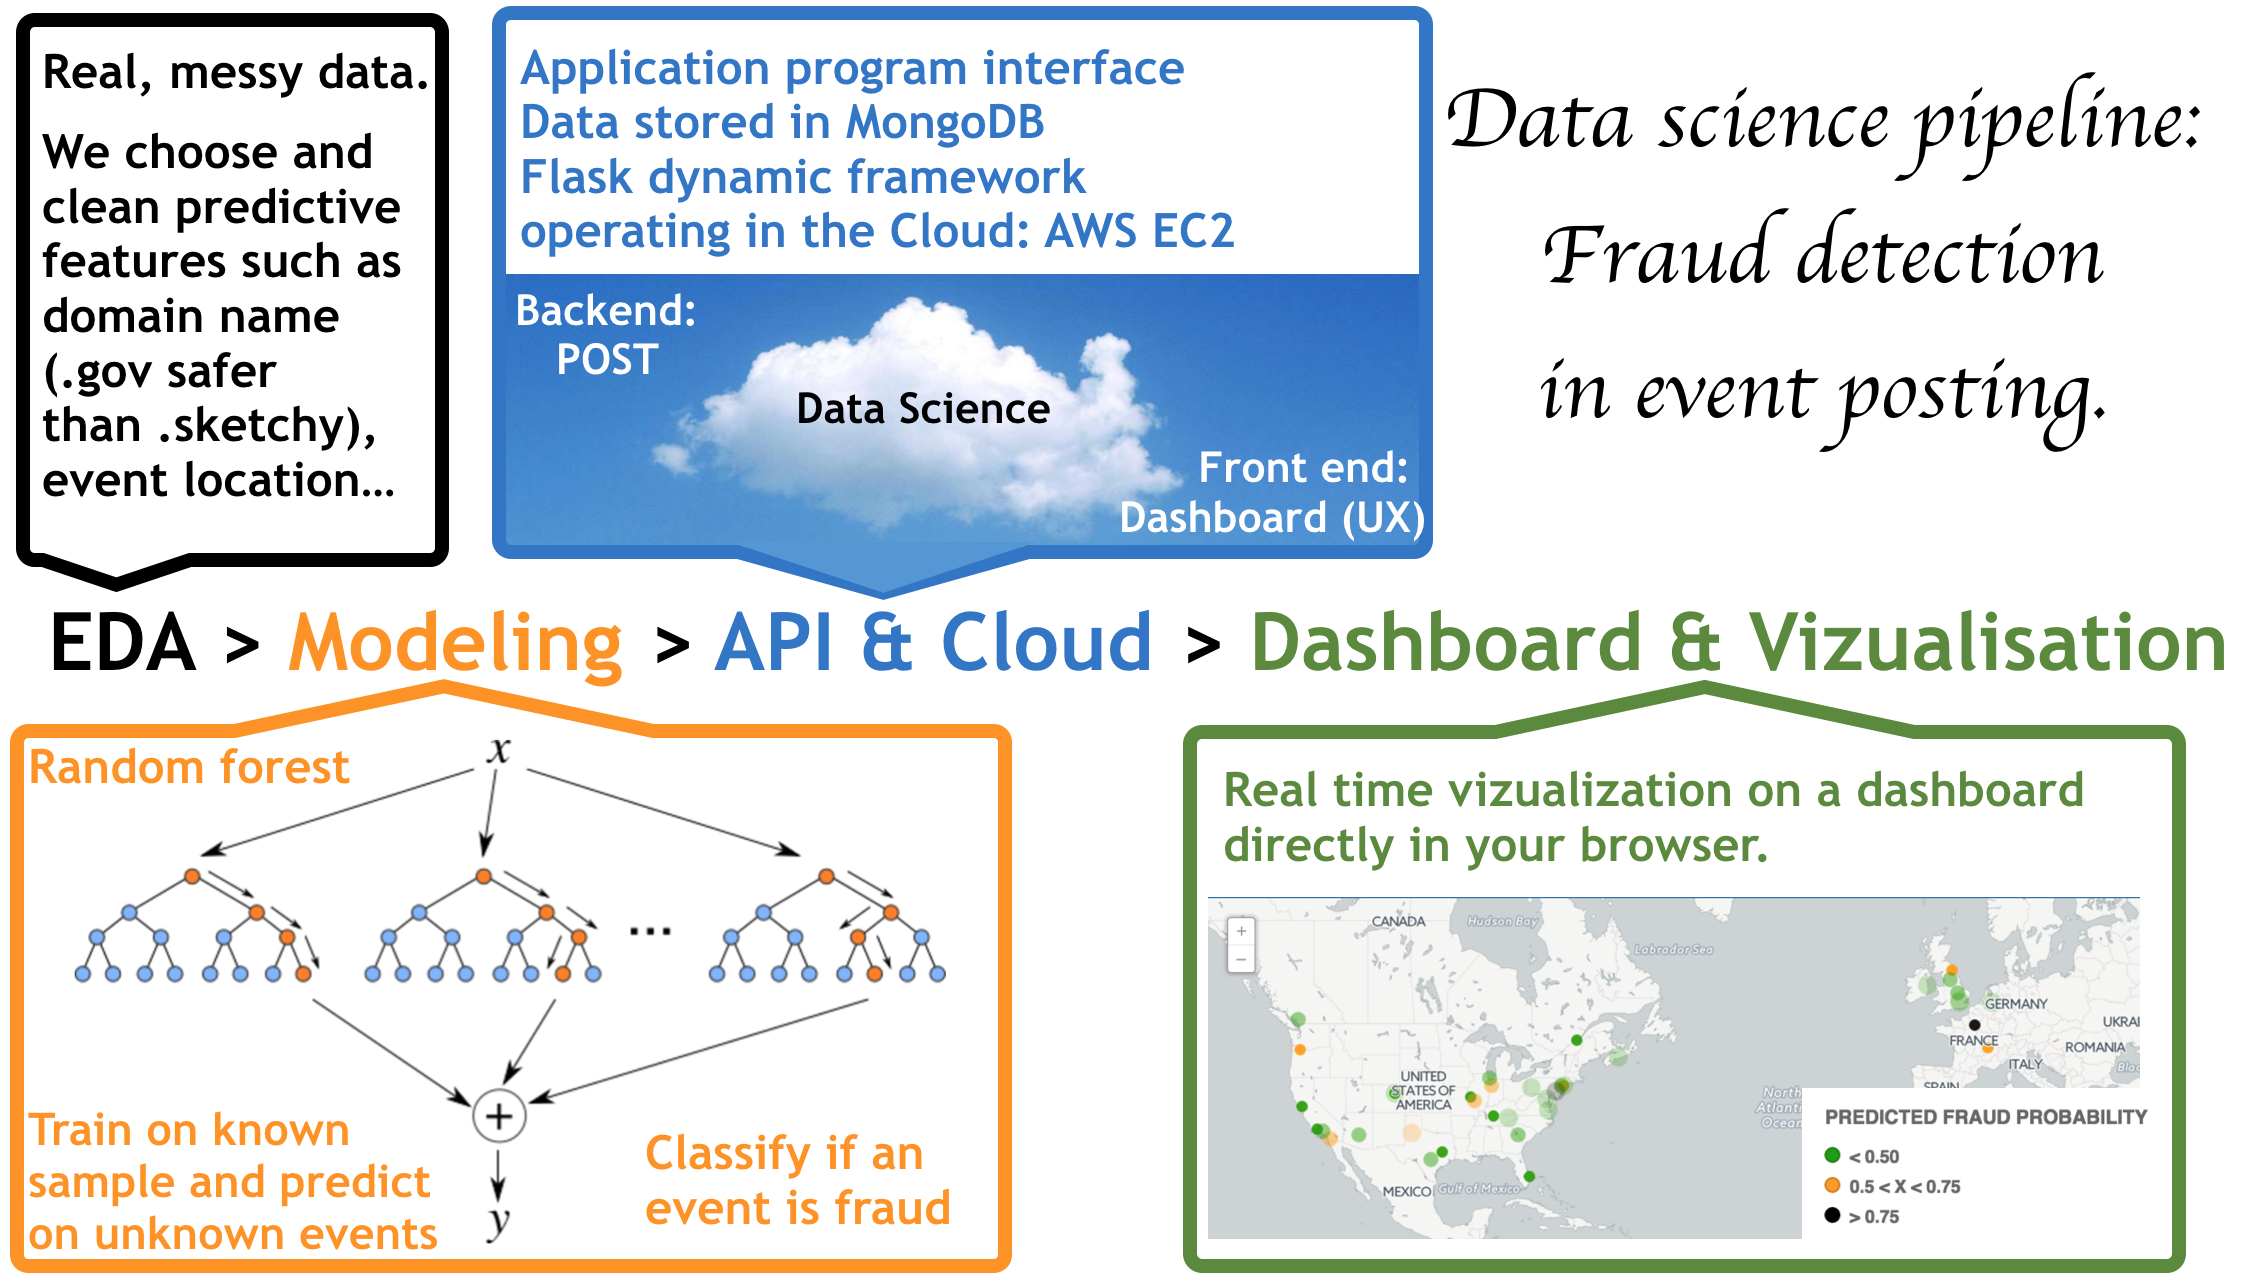
In this page I describe how we built an entire end to end pipeline to detect fraud from a flow of data related to event postings and dynamically present the results to the user on a dashboard accessible from an internet browser. If you are new to data science, this page might look daring but please keep reading: we know this inside out and could explain the concept to a six year old. This study has been performed by Joel Carlson, Real Limoges, Joe Warren and myself in the frame of a 16 hours case study at Galvanize (DSI).
There are a lot of things that are easy to understand:
- What kind of events are we taking about?
Typically: “Hello, we are organizing a lemonade stand in downtown Raleigh to fund the Malcolm X school summer trip. You can pay $10 online and get your spot reserved, we will bring the tables and chairs, you bring the lemonade.”
- What is fraud?
Well you did paypal the money, show up for the event but nothing is happening and your money is not going to fund the school summer trip...
- So: How do you detect fraud?
That's the exciting modeling part! We are getting there. But before, there is something important you should know about data science: Our aim is not merely to detect fraud with the best accuracy and precision, but to build a product that people are going to use.
So here we start, with a person posting an event on the internet.
Exploratory data analysis
Actually not one but 16000 events: That's our original dataset. For each event, we know the 'y', the ground truth (i.e. if an event is fraud or not). This kind of problem (where we know the 'y') are generally called 'supervised learning'. In the dataset, approximately 14000 transactions are not fraudulent, while the remaining 2000 are classified as fraud (14%).
There are 24 features associated with this event post such as: location and date of the event, email address used for the post, ip adress (that we use to localize the origin of the post)... As predictive features we identified the body length of the description, account age, whether the transaction listed a venue, and the email address domain name.
We drop all the variables that have not been judged to be relevant. That's a lot and it's a choice. We want to start with a small, simple model; we can always come back later on and add more features, build up and refine.
Modeling
There are a lot of models that can be applied to supervised learning problems... During the data exploration we notably used logistic regression, random forests and gradient boosting. Thanks to a dynamic collaboration of people these models have been conveniently implemented in
sklearn. If you would like to learn more about how to use these models, you can check the
ds4all supervised learning notebook for a clean and commented code that you can re-use for your own study.
We chose to build a random forest model to predict whether an event posting was fraudulent. The model predictions do not imply a ground truth about whether a transaciton is fraud or not, but rather flags which transactions need further manual review by presenting fraud probability in the dashbord.
How do you choose your model?
We are serious, we define
metrics.
In order to maximize the proportion of frauds that are correctly identified we chose to optimize the recall as our metric.
To gauge the efficacy of the random forest model we first created an 80/20 training/testing split of the data and trained a random forest classifier with the default parameters. This resulted in an initial recall score of 0.34 on the held-out test data.
We then optimized the model by performing a grid search over parameters including the number of estimators, minimum samples per leaf, and the number of features sampled for each tree. The grid search used 5-fold cross validation with each parameter combination, and the parameters with the highest mean recall were selected as the final model parameters.
The optmized random forest model obtained a recall store of: 0.61.
We are creative, we have a
vision. We choose a model that is going to generalize well to new data and easy to use.
Real time vizualisation and dashboard
Once our model is trained, we pickle it (it's a powerful algorithm for serializing and de-serializing a Python object structure, in our case it means that we save the model with all the parameters we learn so we can easily use it later when new data are posted.) We notably use bokeh to interactively visualize the fraud probability in real time; and developed a dashboard that classifies each new posted event upon its fraud probability. We also use cartodb to vizualize the events (fraud probability: green = low, orange = medium, black = high).